
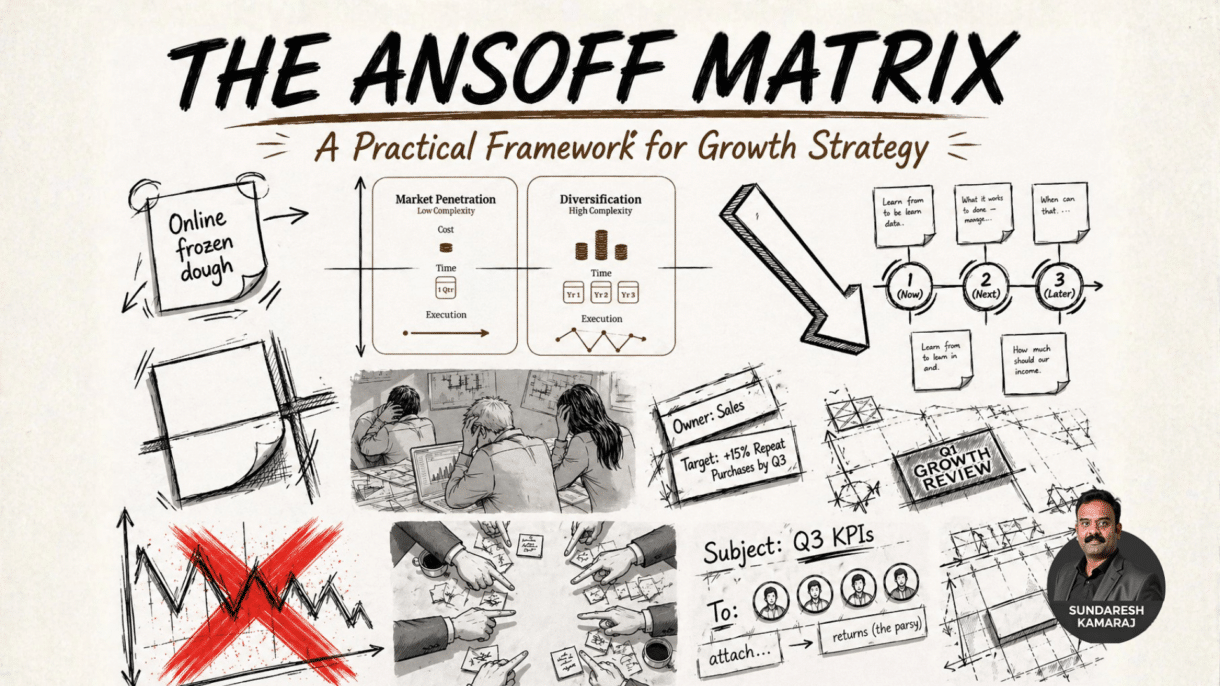

Every founder, CEO, and product leader eventually hits the same wall — what should we grow next, and how risky is that move? The Ansoff Matrix is the simplest and most trusted way to answer that question. In one clean two-by-two grid, this classic growth framework forces a business to declare exactly what kind of expansion it is pursuing and what level of risk it is accepting in return.
Created by Russian-American strategist H. Igor Ansoff in 1957, the Ansoff Matrix has guided everything from corner bakeries to Fortune 500 boardrooms for nearly seventy years. In this comprehensive guide, you will learn how to apply the framework step by step, see two real-world case studies, get a copy-ready implementation checklist, and discover how to combine the matrix with SWOT, PESTLE, Porter’s Five Forces, and the BCG Matrix for a complete strategic system.
Play the Ansoff Matrix Audio in Tamil
1. What Is the Ansoff Matrix? Definition and Origin
The Ansoff Matrix — also called the Product/Market Expansion Grid — is a strategic planning tool that maps four growth options against two simple variables: products and markets. Each variable splits into existing or new, producing four distinct growth strategies arranged in a two-by-two grid.
Igor Ansoff introduced this framework in his landmark 1957 Harvard Business Review article, “Strategies for Diversification.” Nearly seven decades later, the model remains a staple of MBA curricula and corporate strategy offsites worldwide. Its enduring power comes from a single design principle: it converts vague growth ambitions into a disciplined conversation about risk.
Why the Ansoff Matrix Still Matters in 2026
Modern markets reward speed, but speed without direction is dangerous. The Ansoff Matrix is equally useful for a two-person startup deciding what to build next and a multinational planning a ten-year roadmap. It scales because it asks the right question — not “how big can we get?” but “how new is this move, and are we ready for it?”
2. The Four Quadrants of the Ansoff Matrix
Each of the four Ansoff Matrix quadrants represents a fundamentally different growth bet. Understanding them well requires more than memorizing labels — each quadrant has its own logic, playbook, and characteristic failure modes. Let’s break them down one by one.
2.1 Market Penetration — Lowest Risk
Market penetration means selling more of what you already sell, to the customers you already serve. Both the product and the market are familiar, so this is the safest quadrant on the grid. It is the natural starting point for almost every growth conversation.
Common tactics:
- Price adjustments, discounts, and promotional offers
- Loyalty programs and customer referral incentives
- Upselling and cross-selling to current accounts
- Heavier advertising and tighter distribution
- Taking share from competitors via superior service
Penetration has a ceiling, however. Once a business nears market saturation, each additional point of share becomes disproportionately expensive. Over-reliance on this quadrant leaves a business exposed when its core market stops growing.
2.2 Market Development — Moderate Risk
Market development takes an existing, proven product into a new market. “New market” is broader than it sounds — it can mean a new geography, a new customer segment, a new distribution channel, or even a new use case for the same product.
Common tactics:
- Expanding into new cities, states, or countries
- Targeting a new demographic, such as moving from B2C to B2B
- Launching on new channels, like e-commerce or marketplaces
- Repositioning the product for a different use case
The biggest trap here is assuming new markets behave like old ones. Cultural norms, regulations, pricing power, and competitive intensity rarely transfer cleanly across borders or segments. Strong market development always begins with research, not optimism.
2.3 Product Development — Moderate Risk
Product development creates something new for customers you already know. The market is familiar; the offering is not. This quadrant is powerful because it leans on existing trust and distribution — your customers are more willing to try a new product from a brand they already buy from.
Common tactics:
- Launching line extensions, variants, or new SKUs
- Introducing premium, budget, or specialty versions
- Adding complementary products or services
- Significant feature upgrades or next-generation versions
Be warned: most new products fail commercially. Companies that chase novelty without a clear customer insight end up with cluttered portfolios and diluted brand equity. Product development demands real R&D capability, not just enthusiasm.
2.4 Diversification — Highest Risk
Diversification is the boldest quadrant — new products for new markets. Both sides of the equation are unknown, which is why this strategy carries the highest failure rate of the four. It can also unlock the largest payoffs when it works.
Two forms of diversification:
- Related diversification — moving into an adjacent business that shares technology, customers, or capabilities. Lower risk, easier synergies.
- Unrelated diversification — entering a completely different industry. Higher risk, usually pursued for portfolio balance or bold reinvention.
Diversification consumes management attention, capital, and cultural bandwidth all at once. Use it selectively, and only when the strategic logic is clear — for example, when a technology platform genuinely unlocks adjacent industries.
| Stratergy | Focus | Typical Options | Risk |
|---|---|---|---|
| Market Penetration | Existing products, existing markets | Increase share, loyalty programs, aggressive pricing, upselling | Low |
| Market Development | Existing products, new markets | Geographic expansion, new segments, new channels | Moderate |
| Product Development | New products, existing markets | Innovation, line extensions, feature upgrades, R&D | Moderate |
| Diversification | New products, new markets | New business units, acquisitions, new ventures | High |
3. Visual Breakdown: The Ansoff Growth Grid
Risk in the Ansoff Matrix rises diagonally — Market Penetration is the safest quadrant, while Diversification is the most dangerous. The visual below shows how the four growth strategies map across products and markets.
| EXISTING PRODUCTS | NEW PRODUCTS | |
|---|---|---|
| EXISTING MARKETS | Market Penetration Lowest Risk • Sell more to current customers • Boost share, frequency, and loyalty • Use pricing, promos, and referrals | Product Development Moderate Risk • Launch new products to known customers • Leverage trust and distribution • Requires R&D and innovation muscle |
| NEW MARKETS | Market Development Moderate Risk • Take proven products to new markets • Expand geographies, channels, segments • Needs research and localizatio | Diversification Highest Risk • New products for entirely new markets • Related or unrelated diversification • Highest reward, highest failure rate |
The Risk Gradient
A sensible growth portfolio leans heavily on the first three quadrants and uses Diversification selectively, with clear strategic rationale. The further a move sits from the business’s current products and markets, the harder and more expensive it will be to execute successfully.
4. Step-by-Step Guide to Applying the Ansoff Matrix
Applying the Ansoff Matrix is not about dropping ideas into boxes. It is a structured process that connects diagnosis, choice, and execution. The seven steps below are the sequence experienced strategists actually follow.
Step 1: Clarify Your Starting Point
Document where the business stands today — current products, customer segments, geographic footprint, and recent growth performance. Without a clear baseline, the “existing” side of the matrix is ambiguous and every downstream decision inherits that ambiguity.
Step 2: Define What Counts as "New"
Teams frequently disagree on whether a slightly different product or a neighboring segment counts as new. Settle this early. A useful rule: if the business needs fresh capabilities, a new value proposition, or a different go-to-market motion, it is effectively new.
Step 3: Generate Growth Options
Brainstorm initiatives across all four quadrants. Aim for breadth, not polish. Generate at least two or three candidates per quadrant to avoid anchoring on a favorite option too early in the process.
Step 4: Place Each Option in the Matrix
Map every candidate initiative into one of the four quadrants. If an option seems to sit on a boundary, articulate why — boundary cases often reveal unclear thinking about scope or definitions.
Step 5: Assess Risk and Capability Fit
For each option, evaluate market attractiveness, competitive dynamics, required investment, and execution capability. A great opportunity that the business cannot execute is a liability, not an asset.
Step 6: Prioritize and Sequence
Choose a balanced portfolio. Most healthy strategies combine one or two penetration or development moves (to fund the business) with a small number of bolder bets (to open new futures). Sequence them so early wins fund later bets.
Step 7: Define Success Metrics and Review
For every chosen initiative, define measurable outcomes — revenue, share, retention, margin, or strategic milestones — and set a review cadence. Strategy without review is just a wish list.
5. Implementation Checklist
Use the checklists below as practical companions whenever the matrix is being applied — in a strategy offsite, a product planning cycle, or an annual review. Each phase has its own non-negotiables.
✅ Phase 1 — Preparation
- Current product portfolio documented and categorized
- Existing markets and customer segments clearly defined
- Recent revenue, growth, and share data gathered
- SWOT or equivalent internal capability audit completed
- External environment scan (PESTLE / competitor scan) available
- Cross-functional stakeholders identified and invited
✅ Phase 2 — Execution
- Definitions of "existing" and "new" explicitly agreed
- Candidate growth initiatives brainstormed across all four quadrants
- Each initiative placed in the correct quadrant with documented rationale
- Risk level and capability fit scored for each initiative
- Financial estimates attached where possible (investment, payback, risk-adjusted return)
- Final portfolio selected and balanced across risk tiers
- Execution owners and timelines assigned
✅ Phase 3 — Review & Iterate
- KPIs or OKRs defined for every initiative
- Review cadence scheduled (quarterly recommended)
- Early warning indicators identified for the riskier quadrants
- Exit or pivot criteria defined for underperforming initiatives
- Learnings documented and fed back into the next planning cycle
6. Key Facts and Statistics About Growth Strategy
Numbers help anchor strategic discussions. The figures below — a mix of widely cited industry research and patterns observed across decades of corporate strategy work — give the Ansoff Matrix real weight in any boardroom.
The takeaway is clear: the closer a growth move stays to your current products and customers, the higher its probability of success. The Ansoff Matrix is so durable because it makes that probability visible before capital is committed.
7. Case Study 1: FieldFresh Organics
Note: FieldFresh Organics is an illustrative case built for this guide. The numbers reflect typical outcomes when a mid-sized brand executes a balanced Ansoff-driven plan well.
The Business Problem
FieldFresh Organics is a mid-sized organic food brand based in Pune, India, selling cold-pressed juices, plant-based dairy alternatives, and pantry staples through retail outlets in Pune and Mumbai. By Year 5, the company had reached ₹42 crore in annual revenue, but growth had slowed to single digits.
Its two-city retail network was approaching saturation. Competitors were moving aggressively onto major supermarket shelves. Several growth ideas were circulating — a wellness café chain, European exports, a pet-food line, new juice flavors — but there was no shared framework for evaluating them.
Applying the Ansoff Matrix
The leadership team ran a two-day strategy workshop with the Ansoff Matrix as its central tool. Every circulating idea was mapped into one of the four quadrants and stress-tested against capability, capital, and risk.
Market Penetration ideas:
- Loyalty program tied to in-store purchases
- Bundled offers to lift average basket size
Market Development ideas:
- Expand to Bengaluru, Hyderabad, Delhi, and Chennai
- List core SKUs on major e-commerce and quick-commerce platforms
Product Development ideas:
- Plant-based protein range for existing health-conscious customers
- Seasonal limited-edition juice and snack variants
Diversification ideas:
- Wellness café chain — new product, new market
- European export line — new channel, unfamiliar regulations
- Organic pet-food line — new product, new customer base
The Decision and the Results
After structured debate, the team picked a deliberately balanced portfolio — anchored on penetration, fueled by market development, and limited to one focused product launch. All three diversification ideas were deferred for at least eighteen months.
| Metric | Before (Year 0) | After (Year 2) |
|---|---|---|
| Annual Revenue | ₹42 crore | ₹71 crore |
| Active Customer Base | 18,000 | 34,500 |
| Repeat Purchase Rate | 31% | 48% |
| Geographic Markets | 2 cities | 6 cities |
| Product SKUs | 24 | 41 |
| Gross Margin | 38% | 42% |
What the Matrix Actually Changed
The Ansoff Matrix did not generate the ideas — those already existed. It forced each idea to be classified honestly, compared fairly, and stress-tested against capacity. The team’s most valuable decision was the one it chose not to make: the unfunded café concept would have absorbed the exact capital that funded the successful e-commerce launch.
8. Case Study 2: Anita's Bakery in Coimbatore
Sometimes the easiest way to grasp a framework is through a familiar scene. Meet Anita.
Anita runs a small neighborhood bakery in Coimbatore. For three years, she has been famous for one thing — her butter cookies. Regulars come in every Saturday morning, leave with a box, and tell their friends. Business is steady. But Anita wants to grow, and she has been losing sleep over how. .
One afternoon her cousin Ravi, who works in corporate strategy, drops by. Over coffee, Anita lists her ideas: a WhatsApp message to regulars offering buy-three-get-one; a second counter at the new tech park; selling brownies and chocolate chip cookies; or — her most exciting thought — launching an online store that ships frozen ready-to-bake dough across the state.
Ravi pulls out a paper napkin and draws a two-by-two grid.
Anita's Four Options Mapped on the Napkin
WhatsApp promotion → Market Penetration (safest, modest lift). New flavors for regulars → Product Development (medium risk, customers already trust her). Tech-park counter → Market Development (medium risk, new crowd). Frozen dough shipped statewide → Diversification (highest risk, completely different business with logistics, cold chain, and food-safety challenges).
By the time the coffee is finished, Anita has a real plan. Next month: the WhatsApp offer. This quarter: a small brownie trial on weekends. Next year: the tech-park counter. The frozen dough idea goes on a list titled “Not yet — revisit in eighteen months.”
The bakery story contains every lesson of the Ansoff Matrix. The framework did not invent the ideas. It organized them, made the risks visible, and gave Anita a sequence she could actually execute. That is the quiet power of the tool — it turns ambition into a plan.
9. Connecting the Ansoff Matrix With Other Frameworks
The Ansoff Matrix is powerful on its own, but it becomes far more valuable when combined with the other tools in a strategist’s toolkit. Used together, they form an integrated system for diagnosing the situation, choosing the direction, and executing with discipline.
| Complementary Tool | How It Connects to the Ansoff Matrix | Practical Benefit |
|---|---|---|
| SWOT Analysis | Reveals internal capabilities and market conditions before choosing a quadrant | Grounds growth choices in real strengths |
| PESTLE Analysis | Scans macro factors that shape market attractiveness | Signals which markets are politically and economically viable |
| Porter's Five Forces | Measures profitability and competitive pressure in the target market | Prevents entry into structurally unattractive markets |
| BCG Matrix | Classifies the current portfolio into Stars, Cash Cows, Question Marks, Dogs | Tells you which products can fund new moves |
| Customer Segmentation | Identifies underserved segments for development or diversification | Sharpens targeting so launches resonate |
| OKRs and KPIs | Translates chosen strategies into measurable quarterly goals | Keeps execution accountable |
In a mature planning process, the Ansoff Matrix typically occupies the middle of the workflow:
Where the Matrix Sits in a Mature Planning Cycle
Diagnose
SWOT, PESTLE, and Porter's Five Forces clarify where the business stands and what forces are acting on it.
Choose
the Ansoff Matrix is used to generate, classify, and prioritize growth options across the four quadrants.
Allocate
the BCG Matrix and portfolio tools decide which current products fund which new moves.
Execute
OKRs, KPIs, and roadmaps translate chosen initiatives into quarterly delivery targets.
Review
performance reviews feed lessons back into the next diagnostic cycle.
10. Common Mistakes to Avoid
Even experienced teams stumble when applying the Ansoff Matrix. The pitfalls below appear repeatedly in real-world strategy sessions — and each one is preventable.
Five Mistakes That Quietly Sink Ansoff Matrix Sessions
- Mistake #1 - Treating diversification as glamorous by default — it is the riskiest path, not the most sophisticated.
- Mistake #2 - Ignoring execution capacity and pursuing too many initiatives at once.
- Mistake #3 - Using the matrix in isolation rather than alongside SWOT, PESTLE, or customer research.
- Mistake #4 - Mistaking a line extension for genuine innovation.
- Mistake #5 -Forgetting that "doing nothing" is also a choice — and one that deserves explicit comparison.
11. Frequently Asked Questions About the Ansoff Matrix
These FAQ entries are formatted for FAQPage schema markup, helping each answer qualify for Google rich results and voice-search snippets.
What is the Ansoff Matrix in simple terms?
The Ansoff Matrix is a strategic planning tool that maps four growth options — market penetration, market development, product development, and diversification — across two dimensions: existing or new products, and existing or new markets. It helps businesses choose a growth path while clearly understanding the risk involved.
Who created the Ansoff Matrix and when?
The Ansoff Matrix was developed by Russian-American mathematician and strategist H. Igor Ansoff. He introduced the framework in his 1957 Harvard Business Review article titled “Strategies for Diversification.” It has been a cornerstone of strategic management ever since.
What are the four quadrants of the Ansoff Matrix?
The four quadrants are market penetration (existing products to existing markets, lowest risk), market development (existing products to new markets, moderate risk), product development (new products to existing markets, moderate risk), and diversification (new products to new markets, highest risk).
Which Ansoff Matrix strategy is the riskiest?
Diversification is the riskiest strategy because it involves launching new products into new markets — both sides of the equation are unfamiliar. It also has the highest failure rate, but when it works, it can unlock the largest new revenue streams and reduce dependence on a single market.
When should a business use market penetration?
Use market penetration when the existing market is still growing, when the business has untapped share or unused capacity, when competitors look vulnerable, or when resources for bigger bets are limited. It is the natural default and the lowest-risk path to growth.
How is the Ansoff Matrix different from SWOT analysis?
SWOT analysis evaluates a company’s internal strengths and weaknesses alongside external opportunities and threats. The Ansoff Matrix focuses specifically on growth strategy by classifying options into four quadrants based on product and market newness. SWOT diagnoses; Ansoff decides. They work best together.
Can startups use the Ansoff Matrix?
Yes. Although designed for established firms, the Ansoff Matrix is highly useful for startups deciding what to build next, which segment to enter, or whether to diversify. For early-stage companies, it surfaces hidden risk in expansion plans before precious capital is committed.
Is the Ansoff Matrix still relevant in 2026?
Absolutely. Despite being nearly seventy years old, the Ansoff Matrix remains widely used because it cuts through complexity. Modern teams apply it alongside data analytics, customer research, and portfolio dashboards to make growth strategy a continuous, evidence-based discipline rather than an annual paper exercise.
12. Conclusion: Turn Growth Ambition Into a Real Plan
The Ansoff Matrix is one of those rare strategic tools whose simplicity is the source of its strength. Four quadrants, two dimensions, and a single clarifying question: how much newness is this growth move really introducing, and are we ready for the risk that comes with it?
Key Takeaways
Growth has four basic shapes — every initiative fits into one of the four quadrants of the Ansoff Matrix.
Risk rises as familiarity falls — the further from your current products and markets, the harder execution becomes.
A healthy strategy is a portfolio — combine penetration and development bets with selective diversification, never the other way around.
The matrix is a communication tool — it translates complex options into a picture every stakeholder can debate.
Diagnosis comes before placement — the matrix only works when “existing” and “new” are clearly defined.
Integration multiplies value — the matrix performs best alongside SWOT, PESTLE, Porter’s Five Forces, and the BCG Matrix.
Growth decisions shape capital allocation, organizational design, brand identity, and competitive position for years to come. The Ansoff Matrix does not remove the difficulty of those decisions — no framework can — but it makes the difficulty visible. It forces leaders to name the risk, compare alternatives on even ground, and build plans that match both ambition and capability.
Your Next Move
Open a blank document. List every growth idea on your team’s whiteboard. Place each one into a quadrant. Score it for capability fit and risk. Pick the balanced portfolio that fits your capital and people. Then revisit it in ninety days. That is the entire discipline — and the companies that practice it grow on purpose, not by accident.